With more and more emphasis on data anomaly detection and the proliferation of build/buy options, I’ve been exploring auto encoders for a few projects. In a nutshell, Autoencoders are a type of neural network that take an input (image, data) minimize it down to core features and then reverse the process to recreate the input. Key aspect being that the encoding part is actually done in an unsupervised manner hence the ‘auto’.
For example, dismantling a picture of a automobile, taking out every part and representing ( encoding) them as chassis, wheels as representative components and then reassembling them (decoding) from the encoding minimizing some amount of expected reconstruction errors.
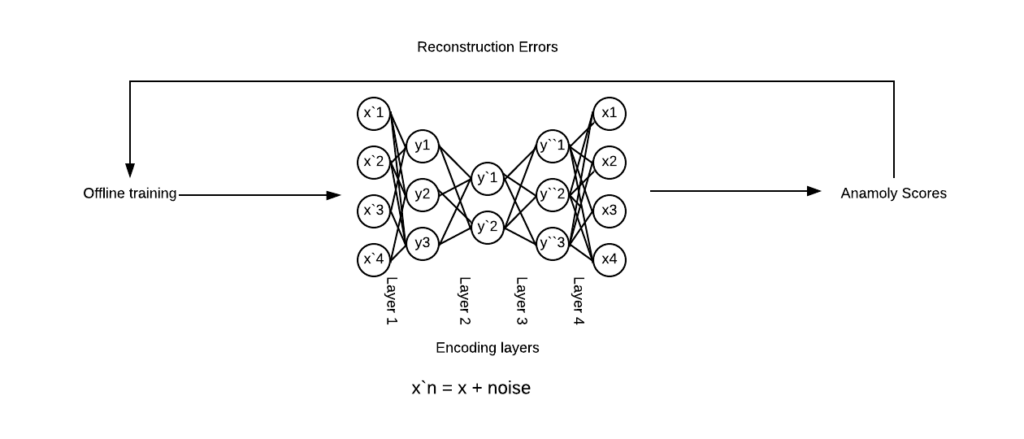
Autoencoders use an encoder that learns the concise representation of the input data and the decoder reconstructs that representation that has been compressed. A lot of the literature online calls this compressed vector to be the “latent space representation”.
The seminal paper on the subject that shows the benefits of Autoencoders has been dissected many times and demonstrates the use of Restricted Boltzmann Machines (a 2-layer Autoencoder consisting of a visible/hidden layer) that learns the difference between the hidden and visible layer using a metric called K-L divergence and provides a greater dimensionality reduction than Principal Component Analysis. Thankfully the implementation is much more approachable than some of the background math used to prove the model!
These are feedforward, non-recurrent neural networks having an input layer, output layer and one of more hidden layers with the count of output nodes matching the input nodes minimizing “noise’ instead of predicting a target variable as we do in supervised learning implementations. Hence, they dont require labels which qualifies them to be unsupervised.
In a market rife with products offering “data quality” solutions, using Autoencoders to detect for anomalies could have the potential for a low cost, easy to use solution built in house to add to existing options.
My focus has been more on exploring this for analyzing data anomalies in structured data. In terms of cost/benefit here, one could argue this might be overkill to use a neural network instead of more rule-based checks on the data which is very valid and extensively used in large enterprises instead of neural net deployments. However, the benefits of squashing the input data into a smaller representative vector help in cases where we deliberately need dimensionality reduction and recognizing outliers at scale. There are tons of material on the web for Image processing using autoencoders for use cases such as image compression, image denoising and medical imaging. For example, fascinating results by converting THIS to THIS make colorizing an engrossing endevor. Also tons of applications in the Natural Language Processing field for understanding text, word embeddings and learning semantic meaning of words.
Autoencoders – unlike GANS can’t generate newer datapoints since their core goal is to determine an identity function suing compression. Also, if the goal is to just achieve compression, they are poor general-purpose image compressors.
There are a few types of an Autoencoder well described here:
- Denoising autoencoder
- Sparse Autoencoder
- Deep Autoencoder
- Contractive Autoencoder
- Undercomplete Autoencoder
- Convolutional Autoencoder
- Variational Autoencoder
Most of the examples I found online dealt with images, so for exploration I used Faker to generate a million records to simulate a data scenario for regular versus non-regular coffee consumers. The irregulars were determined on a random rule say those who spent less than a specified threshold.
The objective was to have the Autoencoder learn from the fabricated data examples on what the values for the “regular” customers were, test against a holdout dataset from the “regular” group and then use the model to identify anomalies post reconstruction to identify cases of irregularities. Essentially, have the autoencoder achieve reasonable compression on the data and then identify anomalous inputs while reading out data with irregular values that do not match the original representation.
Below is a simple gist I created for a walkthrough of the process for a possible implementation with comments inline that should be self-explanatory.
- Customer Test Score : 0.014549643226719535
- Customer Validation Score : 0.014477944187138688
- Irregular Customer Validation Score : 3.541257450764963
The scores reflected the anomaly for a synthetic dataset consisting of a million records and I was able to use spark to scale this to well over 10 million records. Essentially, as you can tell the Irregular Customer validation scores against a validation dataset is around 35% well over the Customer validation score over the entire data set (1%). Next step is to try some of these approaches against more “production”-type data at scale and implement some alerting against this data to make this more actionable.
There are tons of considerations that make a quality data anomaly solution work for particular use cases not limited to Statistical analysis use cases, storage considerations, UI/UX for test case development, the right orchestration tools, database/data lake operability, scaling and developmental costs and security audit requirements. Hence, the methodology for detection is just one piece for a much larger puzzle.
Some interesting reads/videos: